25+ Best Infographic & Data Presentation Templates
Make data engaging with our infographic and data presentation templates. These tools help you present data in a visually compelling way, making complex information more understandable and memorable.

Sketchy Infographic PowerPoint Template
This PowerPoint template uses a different style of design. The infographics are made with a sketch drawing-style design to give them a hand-crafted lo...

Mura Infographic PowerPoint Templates
Mura PowerPoint template has a selection of infographic slides that are commonly used in business and marketing presentations. There are over 35 diffe...

3D Infographics PowerPoint Template
With this PowerPoint template, you can design infographic slides with 3D-like designs. It features 10 creative infographic slides with 3D cylindrical,...

Minimal Animated PowerPoint Infographics
Sometimes the best approach to grab attention to your presentation is to use simple and minimal designs. This PowerPoint template will help you achiev...

Colorful PowerPoint Infographic Template
If you’re a fan of colorful infographic designs, this PowerPoint template is a must-have for you. It features a set of 30 unique slides with man...

Business Infographic PowerPoint Template
If you’re searching for infographic slides for a corporate or business presentation, the infographic slides in this template will come in handy....

Layered Infographic PowerPoint Template
Editing the infographic slides in this template is easy as drag and drop. This PowerPoint template includes 30 different slides with various styles of...

3D Diagram Infographic PowerPoint Template
This PowerPoint includes some creative 3D infographics with different styles of diagram designs. They are perfect for showing off your data in a moder...

Creative Infographic PowerPoint Slides Kit
This PowerPoint template also features 30 high-quality infographic slide layouts that are most suitable for business slideshows. The slides feature tr...

Funnel Infographic PowerPoint Template
Professional marketers will surely find this PowerPoint template most useful. Creating funnels is a big part of planning marketing campaigns. With the...

Professional Infographic PowerPoint Template
The color schemes and the designs used in this PowerPoint template make it a great choice for designing infographics for professional presentations. T...
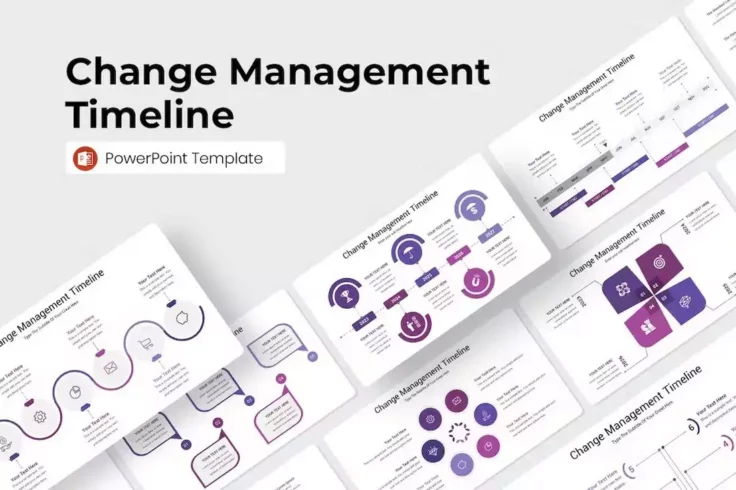
Management Timeline Infographic PowerPoint Template
A collection of management timeline infographics for business presentations. This template includes 16 infographic slides with multiple color themes t...

SWOT PowerPoint Infographics Slides
The SWOT analysis is a popular technique marketers use to assess businesses. This PowerPoint template will allow you to create more effective SWOT inf...

Multipurpose Infographics PowerPoint Template
Another big collection of infographic PowerPoint slides. The infographic designs in this template feature multipurpose layouts so you can customize th...

SWOT Strategy PowerPoint Infographics Template
Make your SWOT analysis much easier to understand with these PowerPoint infographic slides. It lets you choose from multiple styles of infographic des...

Stages of Customer Journey PowerPoint Template
This PowerPoint template includes a very useful and important set of infographic slides that will allow you to create customer journey maps. There are...

Porter’s Five Forces Analysis for PowerPoint
Porter’s Five Forces is another useful marketing tool used to identify and understand the competitors of a business. With this PowerPoint templa...
Arrow Infographic PowerPoint Template
This infographic PowerPoint template is all about arrows. It features 10 unique infographic slides with various designs involving arrows. They are mos...

Tree PowerPoint Infographics Template
The tree infographic designs are useful when showcasing growth and progress. This PowerPoint template will help you design such infographic slides to ...

Business & Finance Infographic PowerPoint Slides
The infographic slides in this PowerPoint template are made with business and finance presentations in mind. There are various styles of timeline, wor...

Circle PowerPoint Infographic Template
This PowerPoint template uses a special approach to its infographic slide designs. They are all designed based on circle layouts. The template include...

Data Visualization PowerPoint Infographics Slides
Presenting data through your slides won’t be a problem when you have this PowerPoint template at your side. It comes with 33 unique slides that ...

Generation Comparison Infographics PowerPoint Template
This PowerPoint infographic template kit will come in handy when making market and audience research presentations. It includes 16 different styles of...

Overlapping Shapes Infographic PowerPoint Template
This PowerPoint template includes a collection of infographics that feature overlapping shapes in circles. This type of infographic is very useful for...

Timeline Infographic PowerPoint Template
Timeline infographics are a must-have slide in presenting project proposals as well as pitch decks. With this PowerPoint template, you’ll have p...
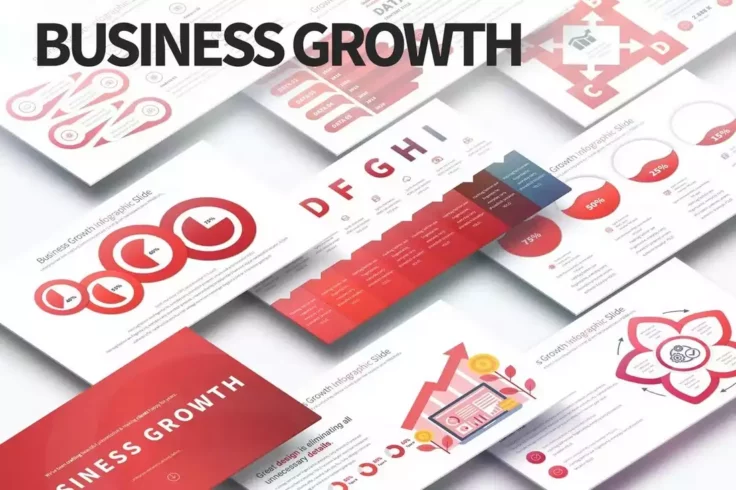
Business Growth PowerPoint Infographics Slides
The slides in this template are designed for showcasing growth and progress. It has 33 unique slides with infographics you can use to showcase your bu...
FAQs About Infographic & Data Presentation Templates
What are Infographic & Data Presentation Templates?
Infographic & Data Presentation Templates are pre-designed visual materials that help creators to present data in an efficient and organized manner. These templates comprise of graphs, charts, diagrams and more, which can be used to translate complex data into a more digestible and understandable format.
These templates are particularly beneficial for businesses and educators who frequently need to communicate data visually. Designing from scratch can be time-consuming and requires a professional skill set, but these templates make information presentation more accessible and easy to do.
How can you customize Infographic and Data Presentation Templates?
Customization depends on the platform you're using for your infographic and data presentation. Most platforms offer options to change colors, text, images, shapes, sizes, and more according to your preference and need. You can also add or remove data sets, change the type of chart/graph, and adjust the layout to better suit your data.
It's important to understand your data thoroughly before using these templates for customization. A clear understanding of your information will allow you to choose the best graphs or charts, color schemes, and layout to represent it effectively.
Why use Infographic and Data Presentation Templates?
Infographic and Data Presentation Templates can play a significant role in simplifying complex data, making it easier to analyze and understand. It’s beneficial for businesses, researchers, educators, or anyone who needs to present data in a visually appealing and straightforward way. They can make a complex dataset easy and friendly to read, aiding in more effective communication.
Another advantage is saving time and resources as these premade templates eliminate the need for creating a presentation design from scratch. The templates come ready-made with effective layouts that have been tested for usability and aesthetics, making it easier than ever to create a professional-looking presentation.
What types of infographic and data presentation templates are available?
There are a multitude of Infographic and Data Presentation Templates available in a variety of different formats to suit different needs. These can range from pie charts, bar graphs, timelines, process diagrams, geographical maps, comparison charts, scatter plots, and more.
Additionally, these templates also come with different design styles such as minimalistic, modern, corporate, playful, and educational. This diversity allows users to find the perfect template to match the tone and style of their specific project or presentation.
Where can I find Infographic and Data Presentation Templates?
Infographic and Data Presentation Templates can be found on various online platforms. Some of the well-known sources are Microsoft Office Suite, Google Slides, Adobe Spark, Canva, and infographic-specific websites. Most of these platforms offer both free and premium templates.
Ensure to choose a reputable source while looking for these templates. A quality source will provide customizable, professional, and well-designed templates, aiding you to create a successful and effective data presentation.