15+ Best Chart & Graph Presentation Templates
Display data effectively with our chart and graph presentation templates. These tools help you visualize data in a clear, easy-to-understand way, enhancing the effectiveness of your presentations.
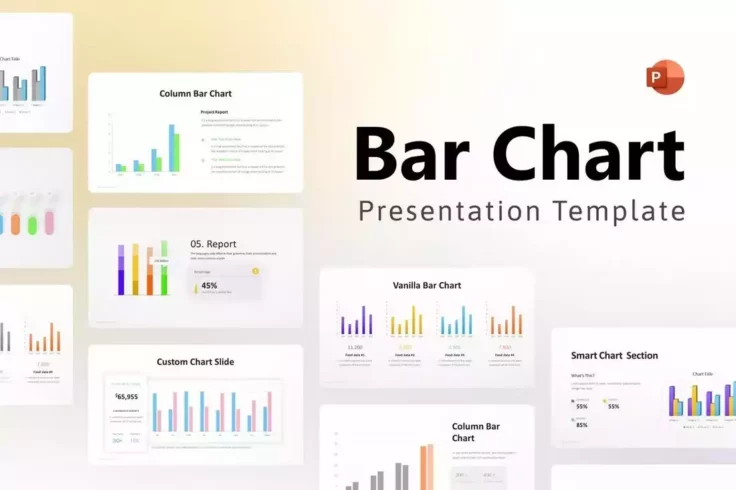
Bar Charts & Infographic PowerPoint Template
Looking for slides with bar chart infographics to show off the progress you’ve made? Then be sure to download this PowerPoint template. It gives...
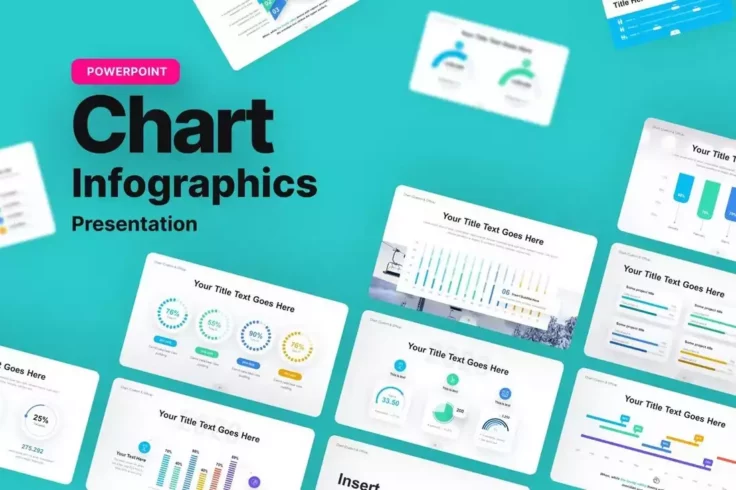
Chart Data Infographic PowerPoint Template
With this PowerPoint template, you’ll get a mix of several different types of charts for your marketing and research presentations. There are pi...
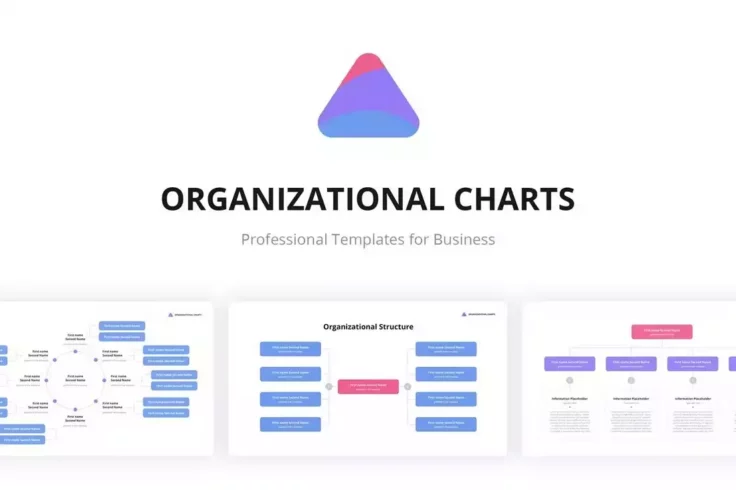
Org Charts PowerPoint Templates
Another PowerPoint template full of org charts for you to showcase your company hierarchy. This template features beautiful org charts with modern and...
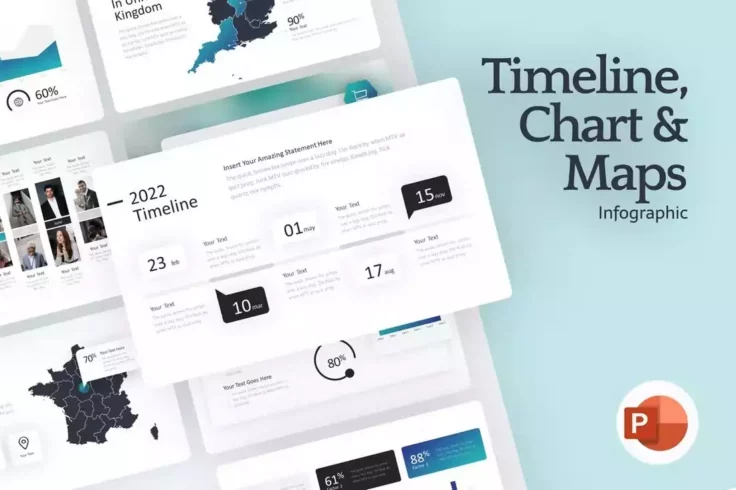
Timeline Maps & PowerPoint Chart Templates
Maps and timelines are great for showcasing demographics and product roadmaps. This PowerPoint charts template comes with plenty of those slides for y...
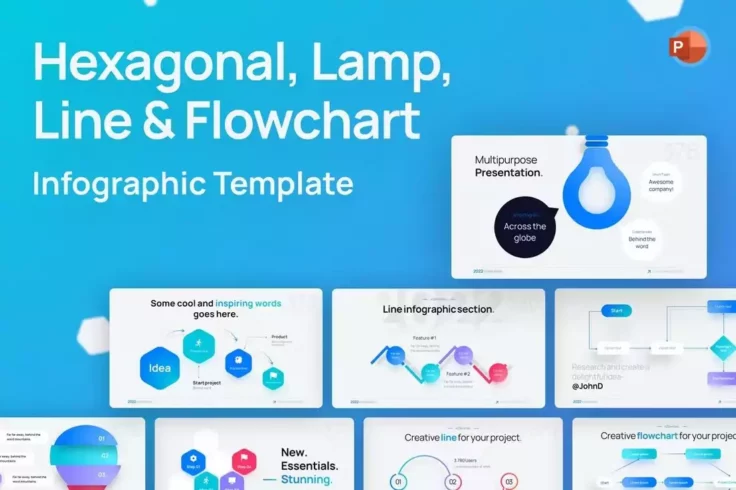
Hexagonal Line & Flow Chart PowerPoint Template
This PowerPoint template includes some of the most creative chart slides we’ve seen. It has multiple styles of chart designs including hexagonal...
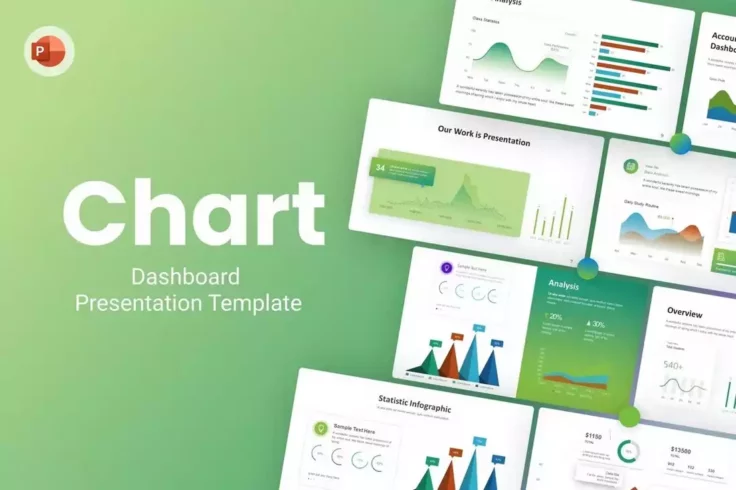
Chart Dashboard PowerPoint Chart Templates
When presenting data, the designs you use is very important. Because when you go that extra mile to design beautiful charts and diagrams, it’s m...
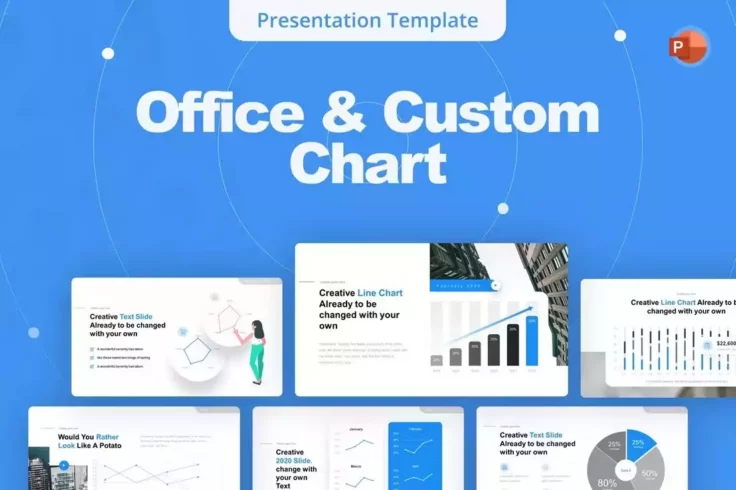
Office & Custom Charts PowerPoint Template
With this PowerPoint template, you can go into office meetings always prepared. It gives you a collection of 20 different charts to present data and s...
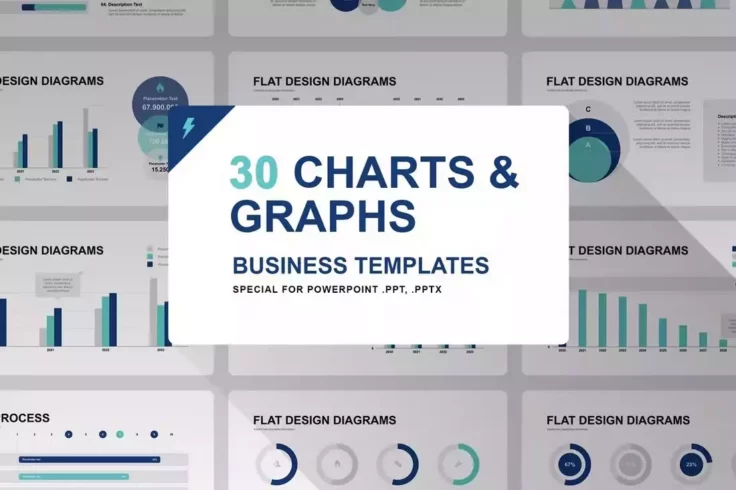
Graphs and Charts for PowerPoint
This PowerPoint template includes 30 unique charts and graphs with clean and minimal designs. They are perfect for presenting data in business, corpor...
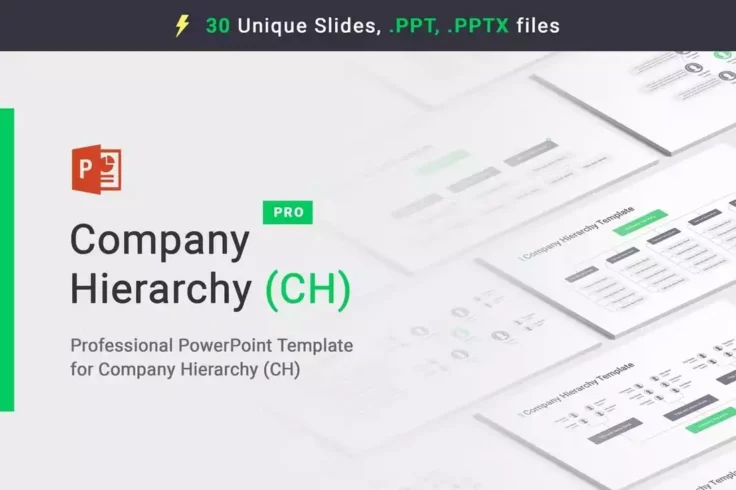
Company Hierarchy PowerPoint Org Charts
You can use this PowerPoint template to design more modern-looking org charts for your presentations and various other projects. It comes with 30 uniq...
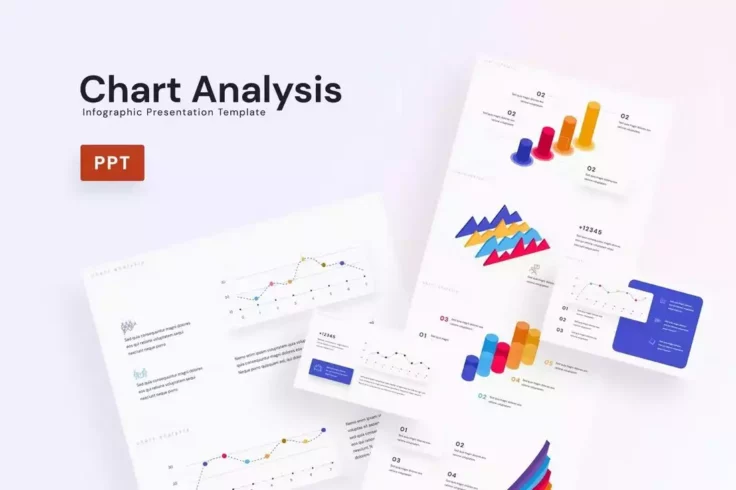
Chart Analysis PowerPoint Charts Template
Whether you’re working on a presentation for a startup or a marketing project, this PowerPoint template will help you add more convincing chart ...
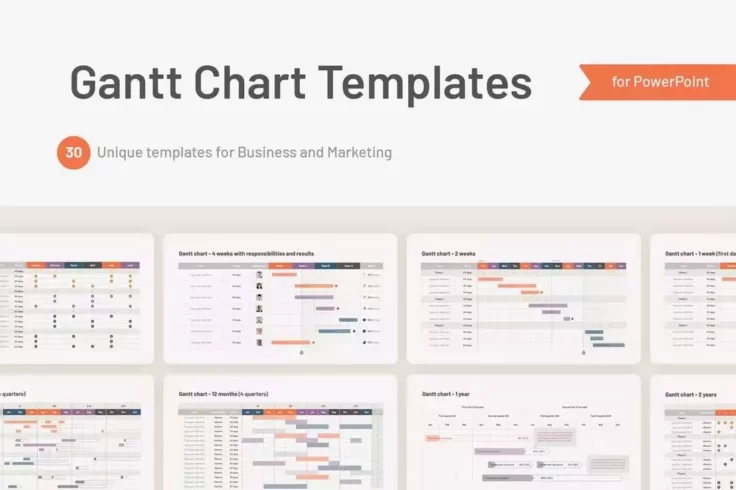
Gantt Chart PowerPoint Templates
A must-have chart in project management presentations, Gantt charts are one of the more difficult chart types to design. This PowerPoint template will...
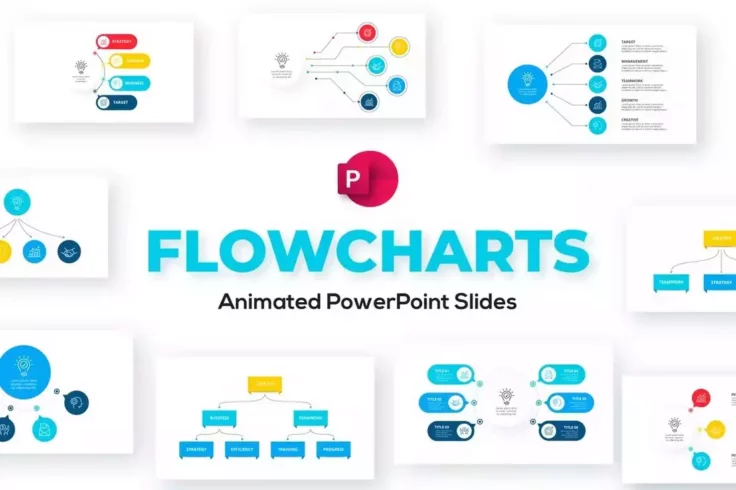
Animated Flow Charts PowerPoint Template
With 20 different styles of flow charts to choose from, this PowerPoint template is a must-have for making professional-looking business and marketing...
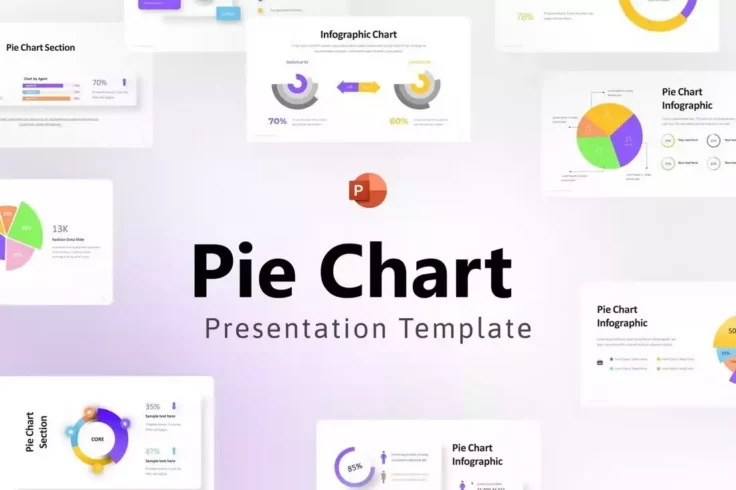
Pie Chart PowerPoint Templates
Designing pie charts is always fun as it gives you the opportunity to get creative with the chart design. This PowerPoint template is a good example t...
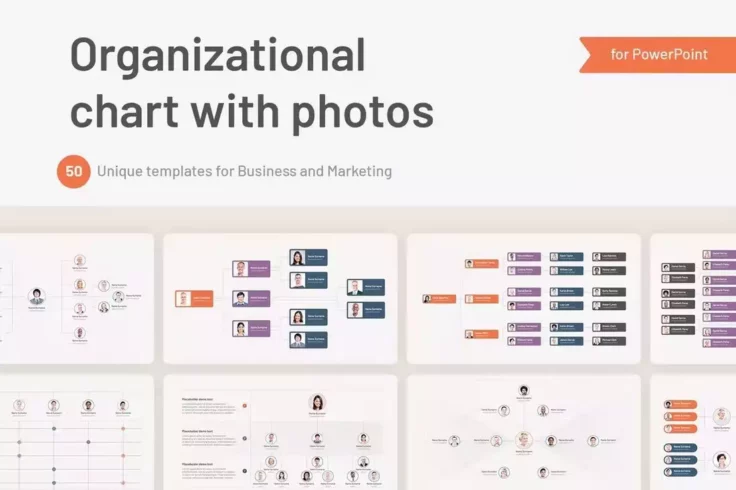
Organizational Hierarchy Org Chart PowerPoint Template
Org charts are used by big companies to streamline and organize the company structure of its employees and their roles. This PowerPoint template comes...
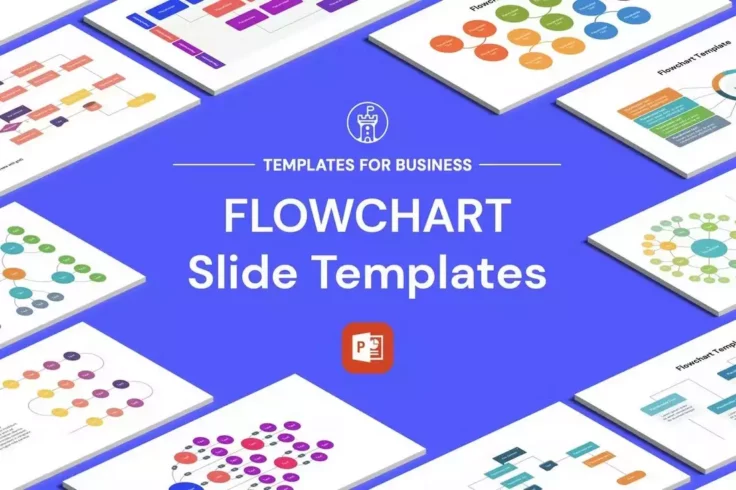
Modern Flowchart PowerPoint Templates
A huge collection of chart slides for PowerPoint. This template features more than 60 different slides with various styles of flowchart designs. Each ...
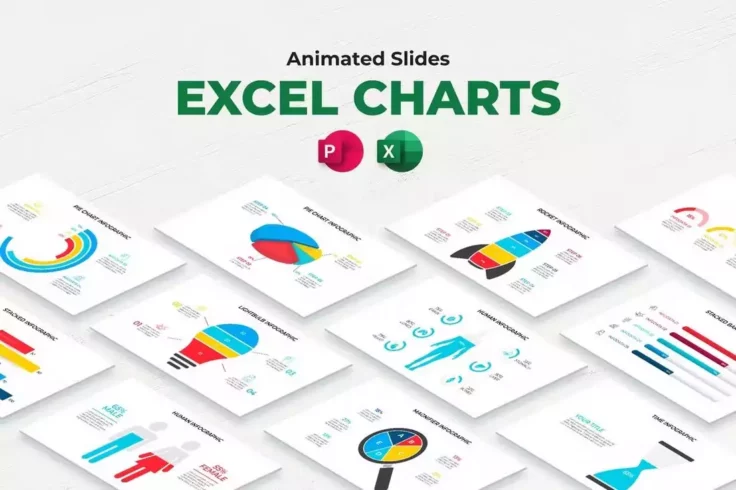
Excel Charts Animated PowerPoint Template
This PowerPoint template also features a collection of beautifully animated chart slides. There are several different types of chart designs in this t...
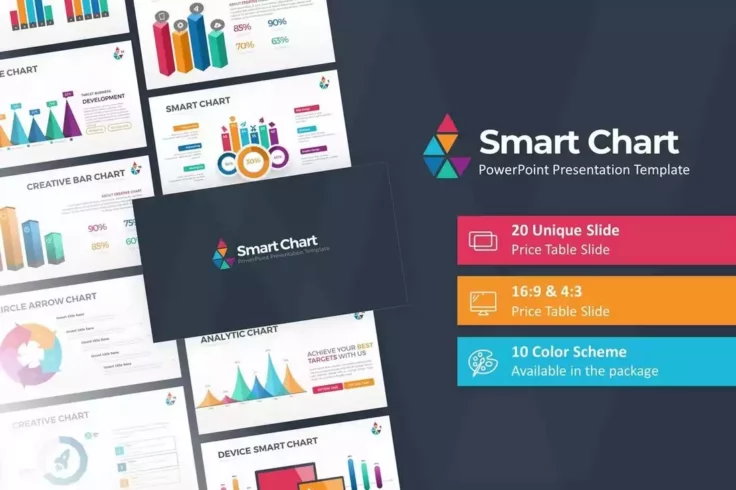
Smart PowerPoint Charts Templates
There are 20 unique chart designs in this PowerPoint template for showcasing your statistics and data in a professional way. It features hand-crafted ...
FAQs About Chart & Graph Presentation Templates
What are Chart & Graph Presentation Templates?
Chart & Graph Presentation Templates are pre-designed layouts for visualizing data and information in a presentation setting. They are customized to depict different types of data structures, such as bar graphs, line graphs, pie charts, etc., in a clear, professional, and attractive manner.
These templates can range from stylized to basic, depending on your needs. They can be edited to suit your specific data and presentation style, offering a streamlined way to organized data for presentations, reports, and projects.
Where can I find Chart & Graph Presentation Templates?
There are many online platforms that offer a variety of Chart & Graph Presentation Templates. Sites like Microsoft Office, Canva, and SlidesGo offer many options to choose from. Some of these platforms allow individuals to have access to a certain number of free templates while others may charge for premium designs.
Most of these websites require a user account for download and editing purposes. Once you've signed up, you can browse multiple categories and choose the templates that best fit your presentation needs.
Can I customize Chart & Graph Presentation Templates?
Yes, one of the key features of Chart & Graph Presentation Templates is that they are customizable. You can insert your own data, adjust colors, text sizes, fonts, and other visual elements to match your presentation's overall theme or your company's branding.
The ability to customize these templates allows for flexibility and personalization, which can help your charts and graphs stand out and effectively deliver your message.
Are there different types of Chart & Graph Presentation Templates?
Yes, there are numerous types of Chart & Graph Presentation Templates available. They can vary greatly depending on the data or information you want to represent. For example, there are templates specifically designed for line graphs, bar graphs, pie charts, scatter plots, histogram, or combination charts, among others.
There are also different styles available, ranging from minimalistic and professional to vibrant and creative templates. This allows you to choose templates that match the tone and nature of your presentation.
Why should I use Chart & Graph Presentation Templates?
Chart & Graph Presentation Templates can help you save a significant amount of time when trying to visually represent data or information. Instead of creating a chart from scratch, you can use these templates and simply input your data. These tools make the creation of complex charts much more accessible.
Additionally, these templates are designed by professionals and can add a polished look to your presentation. This can leave a better impression on your audience and help them better understand the data you are presenting.