HTML and CSS Debugging Tools
Whether you’re a beginner or a pro, troubleshooting your HTML and CSS can be a real pain if you’re not equipped properly. Today we’ll look at a few tools to help you force that pesky web page into submission.
The Default Browser Tools
Before we launch into third party tools, applications and extensions, you should check out the tools available to you right in your browser. Most modern browsers have some developer tools built right into the interface.
Let’s take a quick look at some of the tools Safari provides for developers right out of the box.
Debugging in Safari
Safari’s default development tools are a lot stronger than most people give them credit for. To enable them, go to Safari preferences and check the box under the “Advanced” tab that says “Show develop menu in menu bar.” Now under the Develop menu, go down to “Show Web Inspector.”
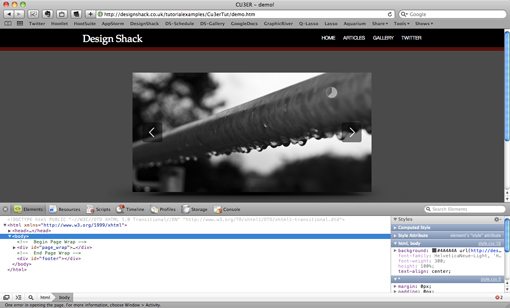
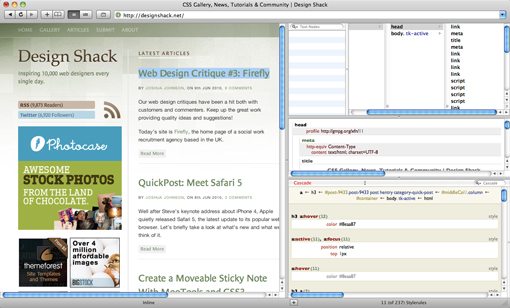
This should pop up a menu at the bottom of your window containing tons of great options for inspecting and debugging web pages. Today we’ll focus on two key areas that contain tools for your debugging process: Resources and Elements.
Under the resources tab you can see all of the files that make up the website. These include scripts, images, html, css, etc. You can also see how long each item is taking to load and if any errors are occurring during the loading process.
Under the Elements tab you’ll see an expandable outline of your HTML:
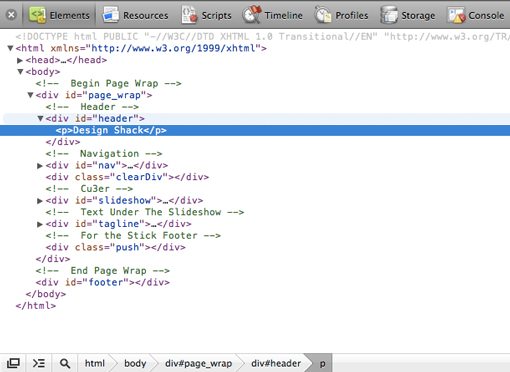
Here you can hover over portions of code and see them highlighted in the site above. You can also click the magnifying glass on the bottom to directly select anything you see on the web page for inspection. The highlighted portion in the page preview allows you to see the padding and margins affecting that element.
By double clicking on any portion of the HTML, you can change anything you want. Keep in mind that these are safe, non-permanent changes that only preview the differences without actually affecting your original file.
Once you select a section or object, you can see any styles associated with that object on the far right of the window.
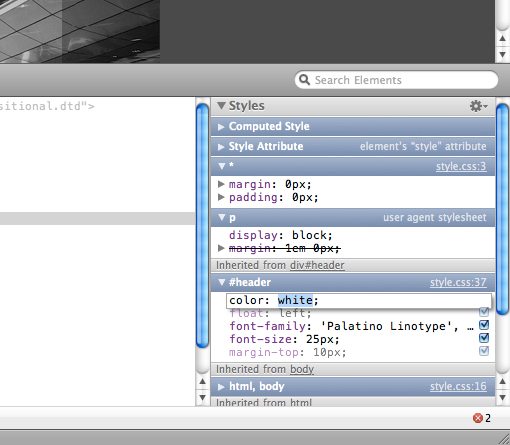
As with the HTML, you can debug and experiment by editing your styles here (double click). For instance, if you wanted to change the header text color to yellow, simply double click “white” and type in a new value. You can also use the little checkboxes to disable portions of code for further debugging flexibility.
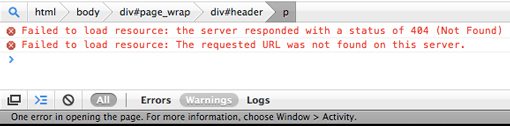
Finally, by clicking the little stop sign shape with an “X” in the very bottom right of the screen, you can see any errors that are occurring when the page is loading (as mentioned above, you can also see these under Resources).
As you can see, Safari is an excellent HTML/CSS debugging tool all on its own. You can view all the associated files and see how/if they are loading, inspect individual elements closely, edit both HTML and CSS right in the browser window, and evaluate errors.
Debugging in Other Browsers
Check out these articles for more on how to use the default developer tools in other browsers:
Firebug
You simply can’t discuss debugging tools without bringing up Firebug. It’s widely regarded as the best option out there for tweaking your CSS inside the browser.
Firebug is a free add-on for Firefox and contains tons of powerful and easy to use features for web developers. Click on the image below to check out the site and download the add-on.
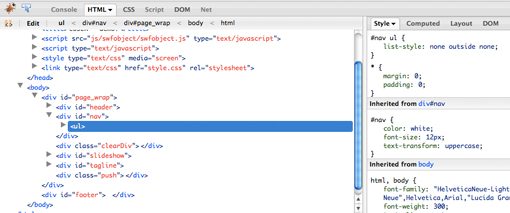
Once you install and activate Firebug, you’ll see a very similar window to the one we saw in Safari pop up at the bottom of the screen. As with Safari, there’s a nice outline of your HTML file with selectable portions and intelligent highlighting in the preview. Here Firebug trumps Safari though by color coding the margins and padding in the website preview for easy visual reference.
Clicking on a section will bring up the associated CSS on the right side.
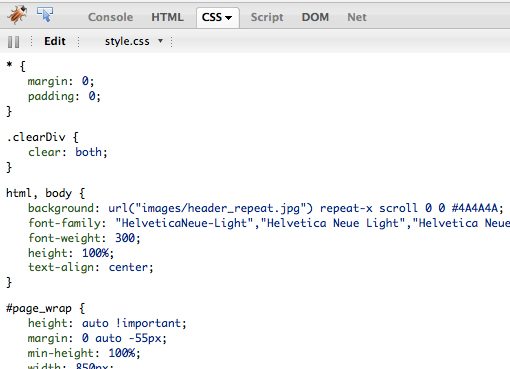
Alternatively, you can click on the CSS tab and see your entire CSS file in a fully editable view. As with Safari, the changes you make here don’t represent actual changes to the file, they’re merely to give you some flexibility for debugging and experimenting.
This merely scratches the surface of what Firebug can do. There are plenty more advanced features for new and seasoned professionals alike. Whether or not you’re a dedicated Firefox user, you should really try Firebug out for yourself.
Firebug Lite
Hopefully, with the new and improved Safari 5 extension system, we’ll be seeing an official Firebug plugin or other third party equivalent some time soon. However, in the mean time, if you’re on any other browser you can use Firebug Lite, a bookmarklet with many (though definitely not all) of the same features as Firebug.
Xyle Scope
Cultured Code, the developers of the amazing productivity app “Things,” created an impressive little application for debugging and tweaking your web pages. Xyle Scope used to cost $20 but has recently become a free download.
You won’t find a link to it on the Cultured Code homepage so I would imagine they have ceased development for Xyle Scope in light of the massive success of Things. Here’s a direct link to the download page.
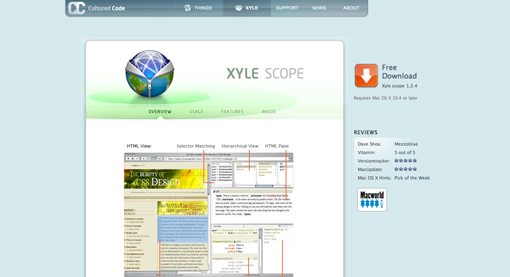
Xyle Scope has a nice split pane view with the website preview on the left and all your tools on the right. You can select items directly on the review and see all their associated attributes. There is a ton of information to examine here including the cascade order, applied styles, selectors, page hierarchy, and more. As with Firebug, Xyle Scope allows you to visually differentiate between the the margins and padding applied to an element.
You can adjust any styles you like and even choose to save the changes. Xyle Scope is an immensely helpful and under-appreciated tool for adjusting your HTML and CSS. It’s really unfortunate that we might not see any further updates for CSS3 and HTML 5 support. If anyone knows different, let me know!
CSS Debug Snippet
The last debugging tool we’ll look at is a clever little hack that you can apply to your CSS right away to examine the layering of elements on the page. I’m not sure who thought of it first, but I’ve seen the snippet on a number of sites around the web (I originally found ithere).
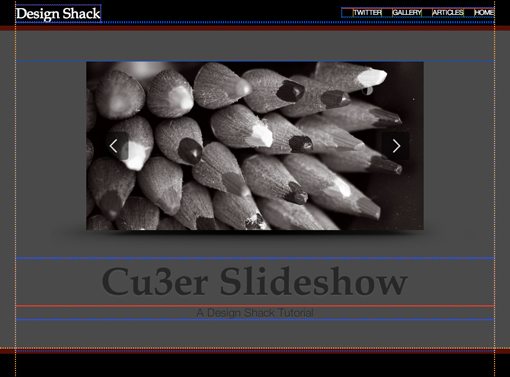
Chris Page describes the snippets functionality in the following way: “I use the following bit of CSS to help visualize the structure of an XHTML (or HTML) document by putting a colored outline around the border of every element. At each level in the hierarchy the color changes so you can see when “depth” changes.”
  * { outline: 2px dotted red }
  * * { outline: 2px dotted green }
  * * * { outline: 2px dotted orange }
  * * * * { outline: 2px dotted blue }
  * * * * * { outline: 1px solid red }
  * * * * * * { outline: 1px solid green }
  * * * * * * * { outline: 1px solid orange }
  * * * * * * * * { outline: 1px solid blue }
The resulting page should look something like the image below:
There’s also a slightly different version that applies a hover item to each line so you only see the dotted lines when you hover over a specific portion. Otherwise, the page appears normal.
  * :hover { outline: 2px dotted red }
  * * :hover { outline: 2px dotted green }
  * * * :hover { outline: 2px dotted orange }
  * * * * :hover { outline: 2px dotted blue }
  * * * * * :hover { outline: 1px solid red }
  * * * * * * :hover { outline: 1px solid green }
  * * * * * * * :hover { outline: 1px solid orange }
  * * * * * * * * :hover { outline: 1px solid blue }
Closing Thoughts
In addition to the tools above, you should always validate both your CSS and HTML. Doing so will help you bypass countless problems and provide you with straightforward information for how to better code your pages.
I hope the tools above prove helpful to you in your quest for pixel perfect site design and layout. Let us know in the comment section below what tools you use to debug and tweak your HTML and CSS!