Graphs and Charts for PowerPoint
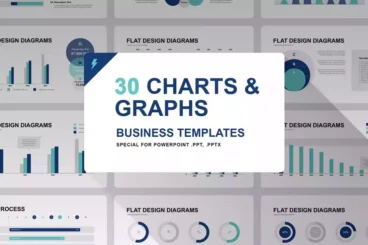


The "Graphs and Charts for PowerPoint" is a resource-saving tool that spruces up business data presentations effortlessly. Its 30 unique charts and graphs feature clean, minimal designs, dedicating full attention to your data without unnecessary frills. This PowerPoint template is a sterling asset for business, corporate, and marketing meetings.
This intuitive PowerPoint template offers you full control over your data visualization. You can personalize each chart to align with your brand's aesthetics or your personal preference. If you seek infographic templates that match this template's uniqueness and simplicity, look in our best infographic PowerPoint templates collection.
The template's professional slide collection avails you high-definition props, supported by all PowerPoint versions. The operation is a breeze; a mere two-click editing process for PowerPoint customization. There's no need to worry about fonts, as Arial is on the in-built configuration. For those about design, you're in luck; the template is Retina ready.
Details & Features
- 30 editable chart and graph templates
- Minimalistic, clean designs
- 16:9 HD aspect ratio, Retina ready
- Supported by all PowerPoint versions (.PPT, .PPTX files)
- No need for extra font installation (Arial)
- Two-click customization process
- Professional high-definition slide templates
Why We Like It
We're big fans of the Graphs and Charts for PowerPoint because of its blend of simplicity and professionalism. It makes data presentation and customization an easy task, freeing up more time for data analysis. Plus, the sheer visual appeal of the minimal, clean designs adds a sophisticated touch to your presentation.