Chart Data Infographic PowerPoint Template

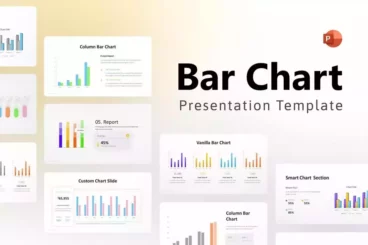
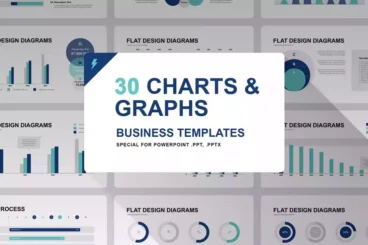
The Chart Data Infographic PowerPoint Template is an essential tool for those who require detailed, engaging presentations. With 30 unique slide layouts, the template includes a multitude of chart options, from pie and bar charts to timelines. These layouts are all fully customizable, allowing users to effectively present their marketing or research data in a visually appealing way.
Infographic materials are more than just tools for presentations - they're a means through which businesses can revolutionize the way information is conveyed and perceived. This template does more than simply display data, it enhances the overall presentation experience. Designed with consideration for all stages of business development, it ensures a holistic brand narrative from the inception of a project, through to its completion.
The Chart Data Infographic PowerPoint Template is highly adaptable, accommodating both light and dark backgrounds. The package includes over 90 XML files for distinguishing your presentation with custom MS Office Theme Colors, and an icon pack to further enrich your content.
Details & Features
- 30 unique slide layouts
- 90+ XML Files (Custom MS Office Theme Colors)
- Options for both light and dark backgrounds
- Widescreen (16:9) format
- Handmade infographic
- Completely customizable
- Free icon pack
Why We Like It
This template stands out due to its exceptional versatility and user-friendliness. It enables users to enhance their presentations by transforming their data into visually compelling infographics. The breadth of chart styles and the degree of customization available also allows users to truly tailor their material to their specific needs and narrative. This makes the Chart Data Infographic PowerPoint Template a terrific investment for solid, professional presentations.


